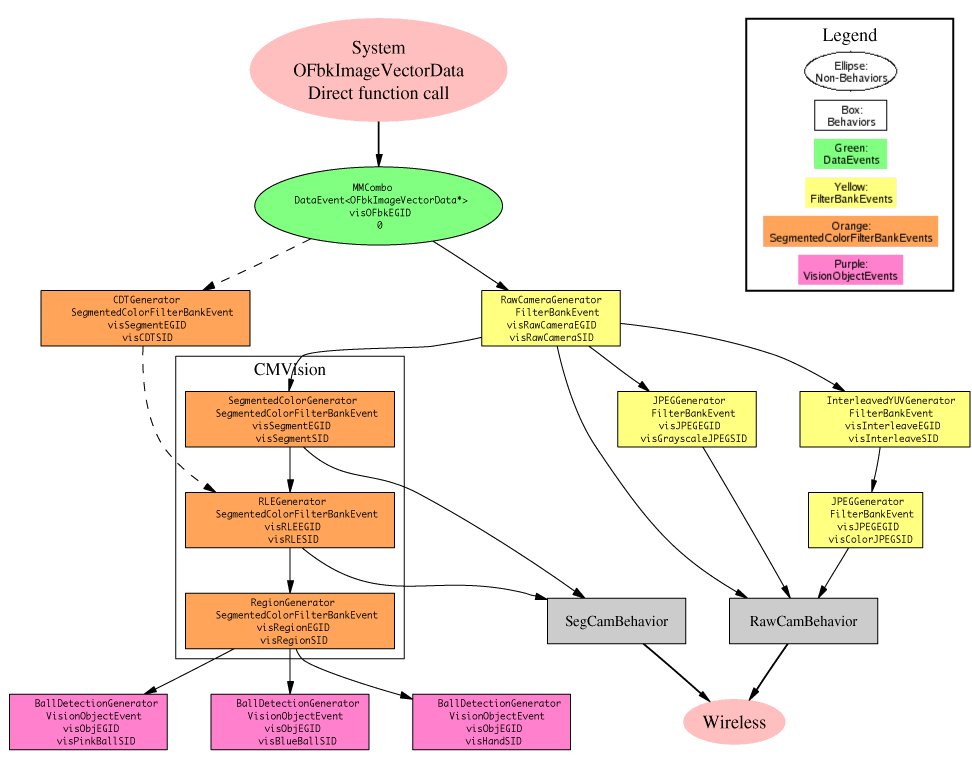
Vision Pipeline Flow Diagram

This diagram was created by dot, from the Graphviz automated diagram layout package, with a little post-processing in Adobe Illustrator to add the legend. It's easy to learn, I recommend trying it out!  Source file: vision_setup.dot

Click regions for more information

MMCombo\nDataEvent<OFbkImageVectorData*>\nvisOFbkEGID\nvisRawCameraSID Wireless RawCamBehavior SegCamBehavior CDTGenerator\nSegmentedColorFilterBankEvent\nvisSegmentEGID\nvisCDTSID RawCameraGenerator\nFilterBankEvent\nvisRawCameraEGID\nvisRawCameraEGID RLEGenerator\nSegmentedColorFilterBankEvent\nvisRLEEGID\nvisRLESID SegmentedColorGenerator\nSegmentedColorFilterBankEvent\nvisSegmentEGID\nvisSegmentSID RegionGenerator\nSegmentedColorFilterBankEvent\nvisRegionEGID\nvisRegionSID BallDetectionGenerator\nVisionObjectEvent\nvisObjEGID\nvisPinkBallSID BallDetectionGenerator\nVisionObjectEvent\nvisObjEGID\nvisBlueBallSID BallDetectionGenerator\nVisionObjectEvent\nvisObjEGID\nvisHandSID JPEGGenerator\nFilterBankEvent\nvisJPEGEGID\nvisGrayscaleJPEGSID InterleavedYUVGenerator\nFilterBankEvent\nvisInterleaveEGID\nvisInterleaveSID JPEGGenerator\nFilterBankEvent\nvisJPEGEGID\nvisColorJPEGSID